Project Report: Atelier AI
Project Title: Atelier AI: Autonomous Sales Intelligence Dashboard & Automated Integrity Engine
Domain: Generative AI (GenAI), Data Analytics, and Automated Operations
Academic Level: Final Year Project Report
Submitted By: Hanish (Roll Number: 16222990020, Branch: Information Technology)
Assigned To: Er.Akshay Bhardwaj
Table of Contents
- Abstract & Executive Summary
- Chapter 1: Introduction & Evolution of Business Intelligence
- Chapter 2: Problem Statement & Literature Review
- Chapter 3: System Design & Multi-Tier Architecture
- Chapter 4: Detailed Module Specifications
- Module 1: Agnostic Data Ingestion & Google Sheets Connectors
- Module 2: 15+ Year Experience AI Lead Data Analyst (Gemini 3.5 Flash)
- Module 3: Draggable Dynamic Grid & Visual Mutation Engine
- Module 4: 24/7 Operations Auditor & Verification Webhooks
- Module 5: Fuzzy Alias Resolution Engine
- Chapter 5: Relational Database Schema & Data Models
- Chapter 6: Key Engineering Challenges & Algorithmic Formulations
- Chapter 7: Detailed Technology Stack Justification
- Chapter 8: Testing, Verification & Quality Assurance
- Chapter 9: Deployment Pipeline & VPS Hosting Configuration
- Chapter 10: Conclusion & Future Scope
1. Abstract & Executive Summary
Traditional Business Intelligence (BI) platforms like Microsoft Power BI or Tableau require complex schema modeling, database constraints, and advanced coding (DAX, SQL) to generate dashboards. These requirements prevent non-technical managers from easily creating or modifying visual panels at runtime.
This capstone project introduces Atelier AI, an AI-native Business Intelligence platform designed to automate data analytics. The platform enables users to connect data sources—like Google Sheets or CSV files—without pre-defining schemas. A built-in Gemini 3.5 Flash analyst engine automatically infers the data structure, performs mathematical evaluations, and suggests relevant KPIs and charts in an interactive checklist modal.
Users compose their dashboards by selecting recommended widgets and arranging them using a draggable grid. At runtime, widgets can be converted between charts and KPI cards on the fly. A conversational AI copilot and PDF report generator allow users to query data in plain language and generate print-ready executive summaries.
Chapter 1: Introduction & The Evolution of Business Intelligence
1.1 Context and Motivation
In modern enterprise environments, data is the key driver of operational efficiency. However, organizations struggle with disconnected datasets scattered across Excel files, PDFs, Google Sheets, and manual entries.
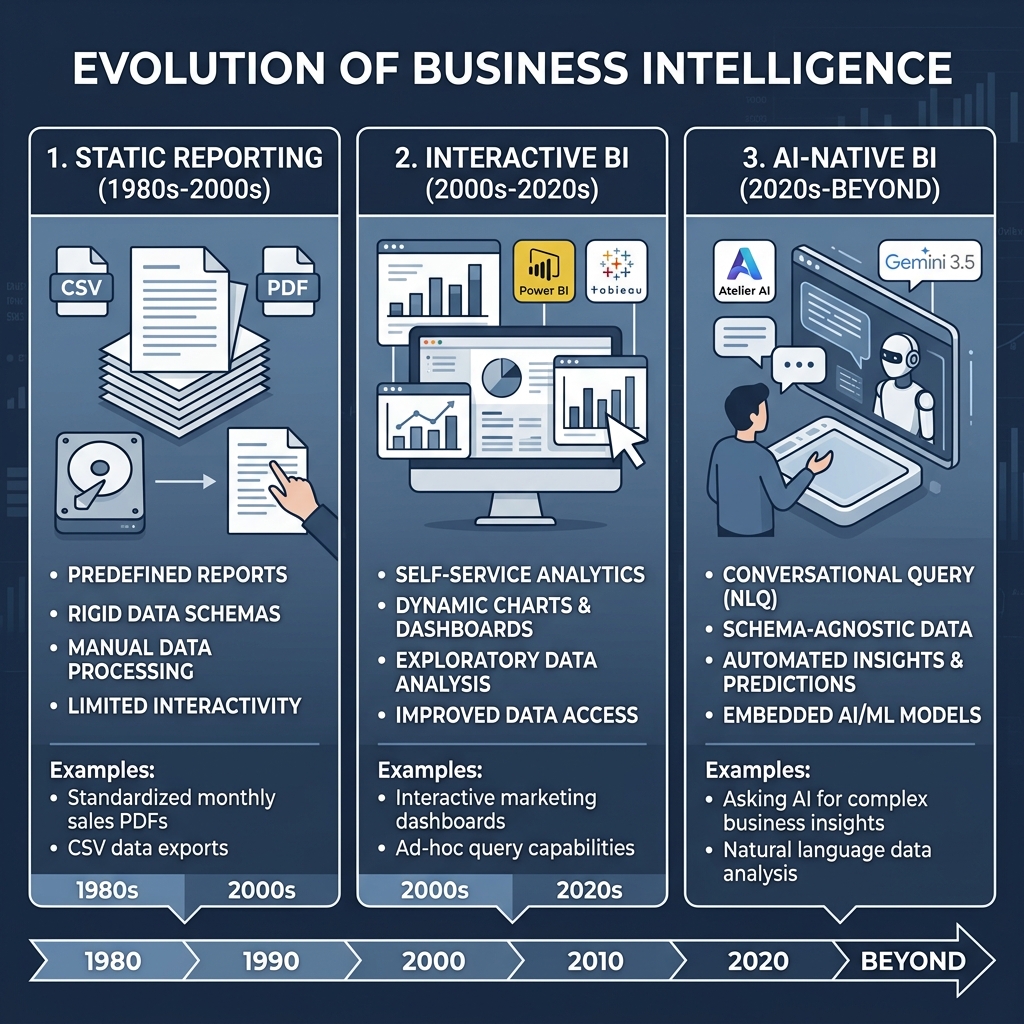
BI Evolution Timeline
Traditional BI tools struggle with this fragmentation. They require manual data engineering and pre-built templates. If a raw file structure changes, the dashboard breaks.
1.2 Project Objectives
Atelier AI aims to address these issues through four core design goals:
- Zero-Schema Ingestion: Accept raw CSV/XLSX file uploads or Google Sheets connections and map the contents into a generic format.
- Autonomous Analysis: Leverage the Gemini 3.5 Flash model to analyze metadata, suggest KPIs, and build dashboards without manual design.
- Dynamic Customization: Allow users to drag, resize, and reconfigure dashboard panels at runtime.
- Operational Auditing: Monitor data integrity, flag backdated modifications, and verify entries using Apps Script email webhooks.
Chapter 2: Problem Statement & Literature Review
2.1 Problem Statement
Modern businesses face four critical bottlenecks when working with traditional BI tools:
- Rigid Schema Requirements: Standard tools require pre-defined tables. Changes to file columns cause dashboards to fail.
- High Development Overhead: Creating custom metrics and charts requires manual DAX formulas, SQL views, and dashboard design.
- Lack of Natural Language Querying: Querying data requires technical knowledge, creating a barrier for non-technical users.
- Operational Auditing Disconnect: Visual dashboards show historical trends but cannot actively flag suspicious entries or detect retroactive edits.
2.2 Comparative Literature Review
The table below compares Atelier AI with standard enterprise BI software:
| Metric / Feature | Microsoft Power BI | Tableau | Atelier AI |
|---|---|---|---|
| Data Ingestion | Requires manual data schema mapping | Requires manual data schema mapping | Schema-agnostic ingestion engine |
| Dashboard Setup | Manual drag-and-drop panel design | Manual drag-and-drop panel design | Autonomous AI layout suggestion |
| Fuzzy Matching | Requires manual DAX/Fuzzy Join rules | Requires manual data preparation | Built-in Jaro-Winkler matcher |
| Runtime Mutation | Static chart panels | Static chart panels | Instant KPI ↔ Chart mutation |
| Data Auditing | None (Passive data reading) | None (Passive data reading) | Active audit logger & Apps Script webhooks |
Chapter 3: System Design & Multi-Tier Architecture
Atelier AI uses a modular architecture combining a React SPA client, an Express.js Node API, and a relational database managed with Prisma ORM.
3.1 System Design & Architecture Layout
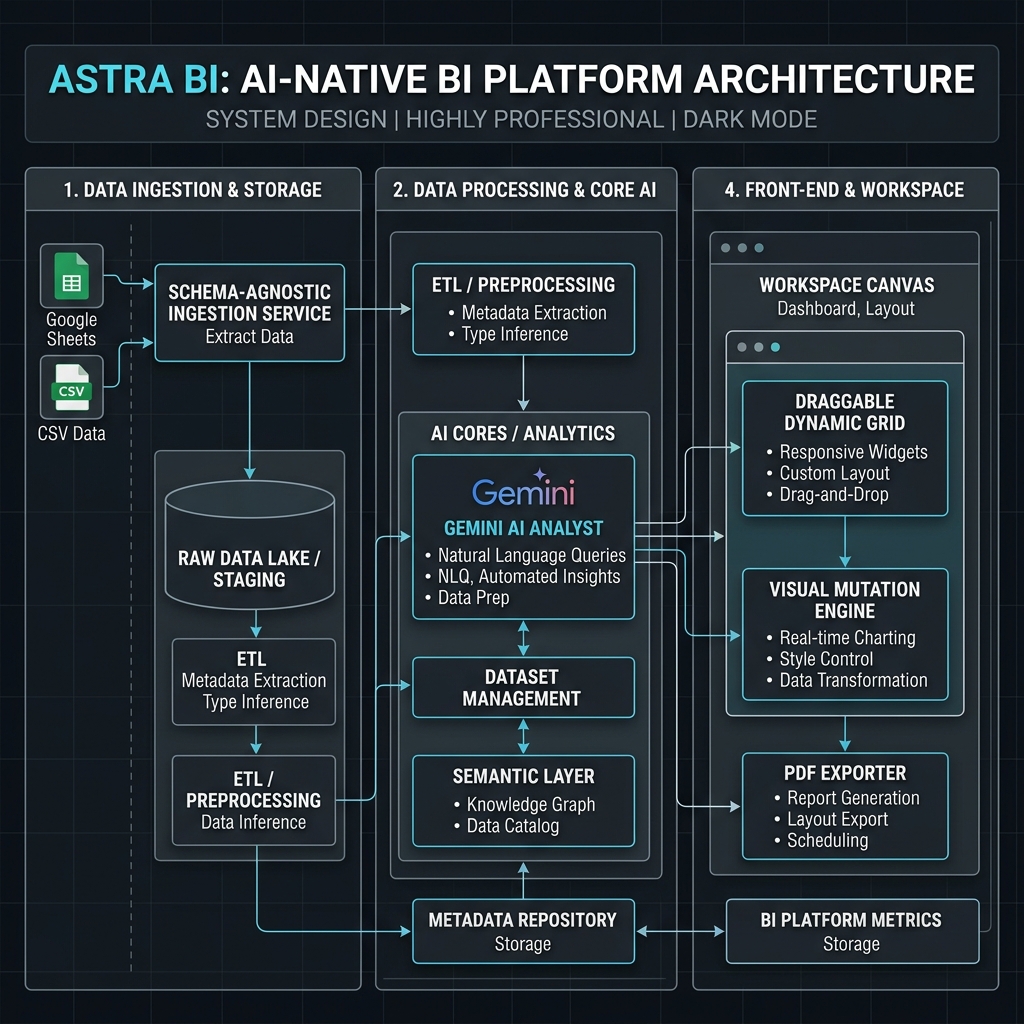
System Architecture Diagram
3.2 Data Flow Chart
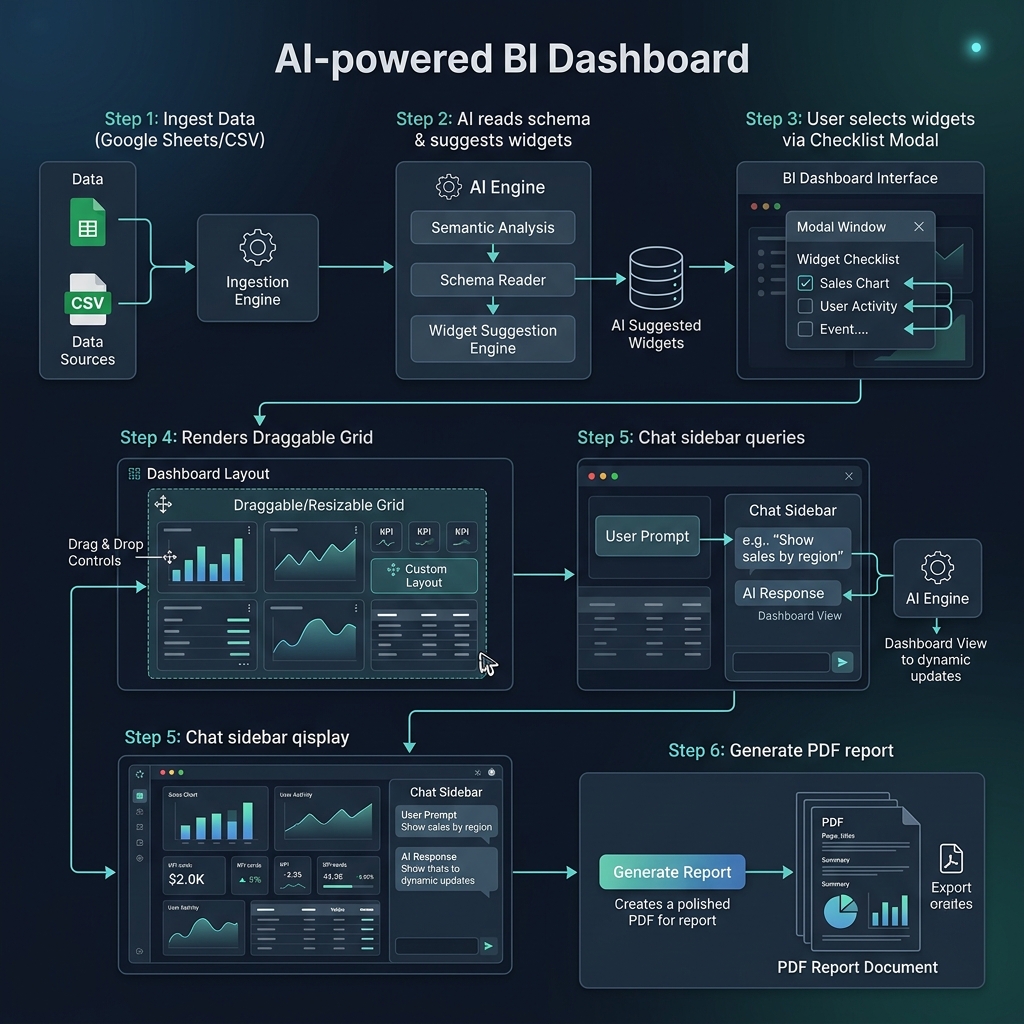
Operations Data Flow Chart
3.3 Database Entity-Relationship (ER) Diagram
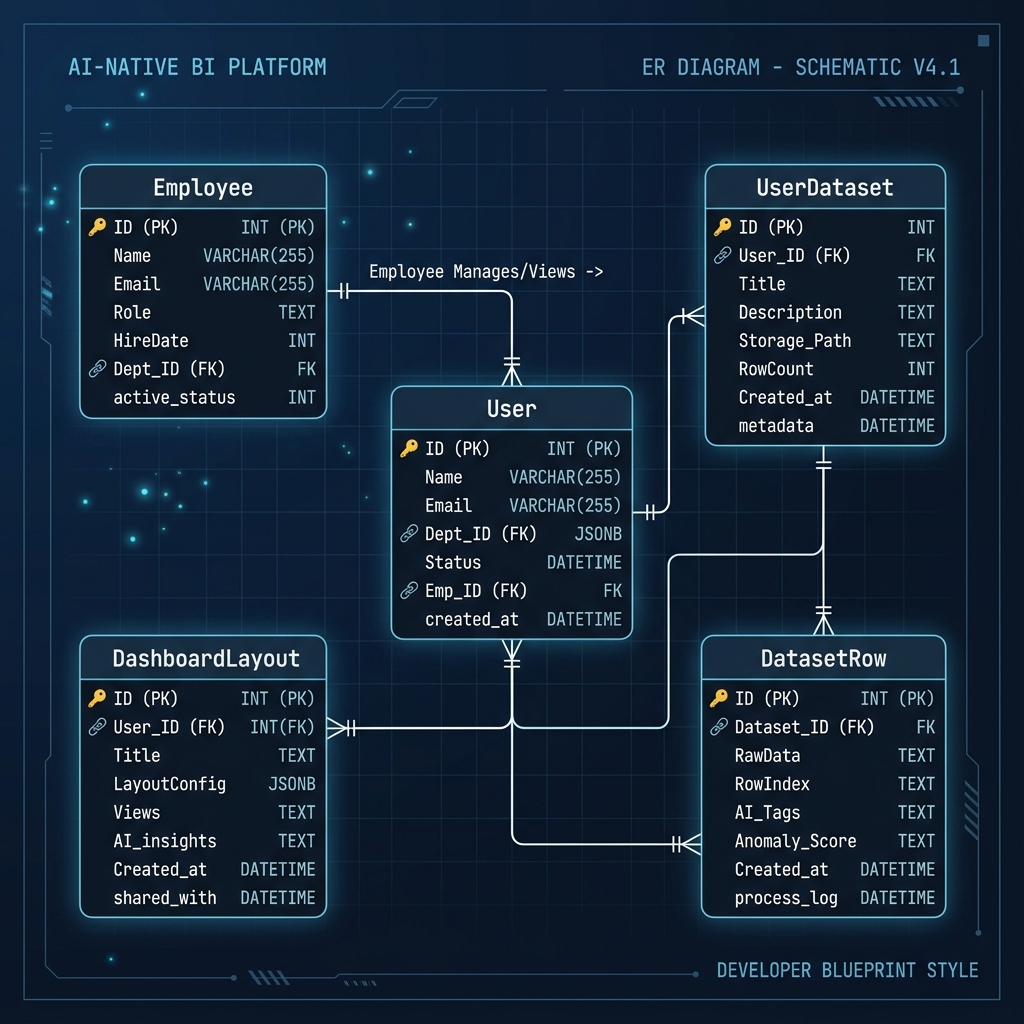
Database ER Diagram
Chapter 4: Detailed Module Specifications
Module 1: Agnostic Data Ingestion & Google Sheets Connectors
To ingest data without requiring fixed table structures, the system maps uploaded files into a flat document structure.
- Google Sheets Ingestion Pipeline:
- Excel/CSV Parsing Engine:
The system extracts the unique spreadsheet identifier from pasted URLs and fetches the spreadsheet data via the Google Sheets API.
Uploaded files are parsed using the xlsx library, and values are converted into JSON strings before database insertion.
// Agnostic CSV/XLS Ingestion Controller
export async function ingestDataset(req, res) {
  try {
    const file = req.file;
    const workbook = xlsx.readFile(file.path);
    const firstSheetName = workbook.SheetNames[0];
    const rawRows = xlsx.utils.sheet_to_json(workbook.Sheets[firstSheetName]);

    // Auto-detect columns and data types
    const columns = Object.keys(rawRows[0] || {}).map(header => {
      const sampleVal = rawRows[0][header];
      return {
        header,
        type: typeof sampleVal === 'number' ? 'number' : 'string'
      };
    });

    const dataset = await prisma.userDataset.create({
      data: {
        name: file.originalname,
        source: 'xls_upload',
        userId: req.userId,
        columnsJson: JSON.stringify(columns)
      }
    });

    // Bulk insert parsed rows as flat documents
    const rowPromises = rawRows.map(row => prisma.datasetRow.create({
      data: {
        datasetId: dataset.id,
        rowDataJson: JSON.stringify(row)
      }
    }));
    await Promise.all(rowPromises);

    res.status(201).json({ success: true, datasetId: dataset.id, columns });
  } catch (error) {
    res.status(500).json({ error: error.message });
  }
}
Module 2: 15+ Year Experience AI Lead Data Analyst (Gemini 3.5 Flash)
Once a file is uploaded, the Gemini 3.5 Flash analyst engine evaluates the dataset structure and recommends appropriate visualization widgets.
- Metadata Prompt Formulation:
Rather than uploading the entire dataset, which would consume significant token bandwidth, the system creates a prompt summarizing the columns, data types, and a 3-row data preview.
[SYSTEM PROMPT]
You are a Lead Data Analyst with 15+ years of experience in enterprise BI dashboards.
Analyze the following dataset columns and preview rows. Recommend 4-6 visualization widgets.
You must return only a valid JSON array matching the SuggestedWidget schema.

[DATASET SCHEMA]
Columns: ${JSON.stringify(columns)}
Preview: ${JSON.stringify(previewRows)}
Module 3: Draggable Dynamic Grid & Visual Mutation Engine
Atelier AI allows users to customize their dashboard by moving, resizing, or changing the visualization type of layout widgets.
- Grid Layout Serialization:
The system saves the layout state—including coordinates and panel sizes—to the database, ensuring positions persist across user sessions.
// Dashboard layout state definition
interface WidgetLayout {
  i: string;       // Widget ID
  x: number;       // Column position (0-11)
  y: number;       // Row position
  w: number;       // Card width
  h: number;       // Card height
  minW?: number;
  minH?: number;
}
Module 4: 24/7 Operations Auditor & Verification Webhooks
The auditing engine monitors data modifications in real-time, logging flags if changes are made to locked or historical data.
- Retroactive Changes Auditing:
When a database record is modified, the system compares the updated values to the original entry:
\Delta = \text{Value}_{\text{current}} - \text{Value}_{\text{historical}}
- Google Apps Script Welcome and Bounce Webhook:
When a new customer record is added, the system fires an asynchronous webhook to Google Apps Script. This script sends a welcome email and returns a webhook response flagging the entry if the message bounces.
// Google Apps Script Webhook Implementation
function doPost(e) {
  var postData = JSON.parse(e.postData.contents);
  var email = postData.email;
  var customerName = postData.name;
  var leadId = postData.leadId;

  try {
    MailApp.sendEmail({
      to: email,
      subject: "Welcome to Atelier Auto",
      body: "Hello " + customerName + ",\nThank you for choosing us."
    });

    return ContentService.createTextOutput(JSON.stringify({
      status: "delivered",
      leadId: leadId
    })).setMimeType(ContentService.MimeType.JSON);
  } catch (error) {
    // If the email address is invalid or bounces
    var payload = {
      event: "bounce_alert",
      leadId: leadId,
      email: email,
      error: error.toString()
    };

    // Post bounce notification back to Node API
    UrlFetchApp.fetch("https://your-api.com/api/webhooks/mail-bounce", {
      method: "post",
      contentType: "application/json",
      payload: JSON.stringify(payload)
    });

    return ContentService.createTextOutput(JSON.stringify({
      status: "bounced",
      leadId: leadId,
      error: error.toString()
    })).setMimeType(ContentService.MimeType.JSON);
  }
}
Module 5: Fuzzy Alias Resolution Engine
The Fuzzy Alias Resolution Engine uses Jaro-Winkler string similarity to match raw user entries to canonical database profiles.
// Jaro-Winkler similarity implementation
export function getJaroWinklerSimilarity(s1, s2) {
  s1 = s1.toLowerCase().trim();
  s2 = s2.toLowerCase().trim();
  if (s1 === s2) return 1.0;

  const len1 = s1.length;
  const len2 = s2.length;
  const matchWindow = Math.floor(Math.max(len1, len2) / 2) - 1;

  const matches1 = new Array(len1).fill(false);
  const matches2 = new Array(len2).fill(false);

  let matchCount = 0;
  for (let i = 0; i < len1; i++) {
    const start = Math.max(0, i - matchWindow);
    const end = Math.min(len2, i + matchWindow + 1);
    for (let j = start; j < end; j++) {
      if (!matches2[j] && s1[i] === s2[j]) {
        matches1[i] = true;
        matches2[j] = true;
        matchCount++;
        break;
      }
    }
  }

  if (matchCount === 0) return 0.0;

  let transpositions = 0;
  let k = 0;
  for (let i = 0; i < len1; i++) {
    if (matches1[i]) {
      while (!matches2[k]) k++;
      if (s1[i] !== s2[k]) transpositions++;
      k++;
    }
  }

  const jaro = (matchCount / len1 + matchCount / len2 + (matchCount - transpositions / 2) / matchCount) / 3;

  // Winkler prefix scaling
  let prefixLen = 0;
  for (let i = 0; i < Math.min(4, len1, len2); i++) {
    if (s1[i] === s2[i]) prefixLen++;
    else break;
  }

  return jaro + prefixLen * 0.1 * (1 - jaro);
}
Chapter 5: Relational Database Schema & Data Models
Managed via Prisma ORM, the database schema stores users, uploaded datasets, layout preferences, and AI conversations:
datasource db {
  provider = "sqlite" // Easily changed to "postgresql"
  url      = env("DATABASE_URL")
}

generator client {
  provider = "prisma-client-js"
}

model User {
  id           Int                @id @default(autoincrement())
  username     String             @unique
  passwordHash String
  role         String             // ADMIN, GM, CRE
  datasets     UserDataset[]
  layouts      DashboardLayout[]
  createdAt    DateTime           @default(now())
}

model UserDataset {
  id          Int               @id @default(autoincrement())
  name        String
  source      String            // google_sheets, csv_paste, xls_upload
  uploadedAt  DateTime          @default(now())
  columnsJson String            // Serialized column types
  userId      Int
  user        User              @relation(fields: [userId], references: [id], onDelete: Cascade)
  rows        DatasetRow[]
  layouts     DashboardLayout[]
}

model DatasetRow {
  id          Int         @id @default(autoincrement())
  datasetId   Int
  dataset     UserDataset @relation(fields: [datasetId], references: [id], onDelete: Cascade)
  rowDataJson String      // Flat JSON row content
}

model DashboardLayout {
  id        Int         @id @default(autoincrement())
  userId    Int
  user      User        @relation(fields: [userId], references: [id], onDelete: Cascade)
  datasetId Int
  dataset   UserDataset @relation(fields: [datasetId], references: [id], onDelete: Cascade)
  layoutKey String      // e.g. dashboard.layout.user_12
  widgetJson String     // Serialized widget layout & config
  updatedAt DateTime    @updatedAt
}

model AiMemory {
  key       String   @id
  value     String
  updatedAt DateTime @updatedAt
}
Chapter 6: Key Engineering Challenges & Algorithmic Formulations
6.1 Schema-Agnostic JSON Processing
Problem: Traditional SQL databases require pre-defined tables. A database built for "Sales" cannot accept an "HR Sheet" without manual database migrations.
Solution: Atelier AI uses a JSON-Document model within a relational database. When a new sheet is connected, the column headers are parsed at runtime, and the rows are stored as JSON strings in the DatasetRow model. The frontend reads the dataset schema from UserDataset.columnsJson and constructs SQL aggregation queries dynamically using database JSON extractors.
6.2 Jaro-Winkler String Distance Formula
The Jaro-Winkler distance (d_w) is used to match user entries to database profiles, scoring prefixes higher to match names accurately:
d_w = d_j + \ell p (1 - d_j)
Where:
- d_j is Jaro distance.
- \ell is the length of common prefix (up to 4 characters).
- p is a constant scaling factor (default 0.1).
Chapter 7: Detailed Technology Stack Justification
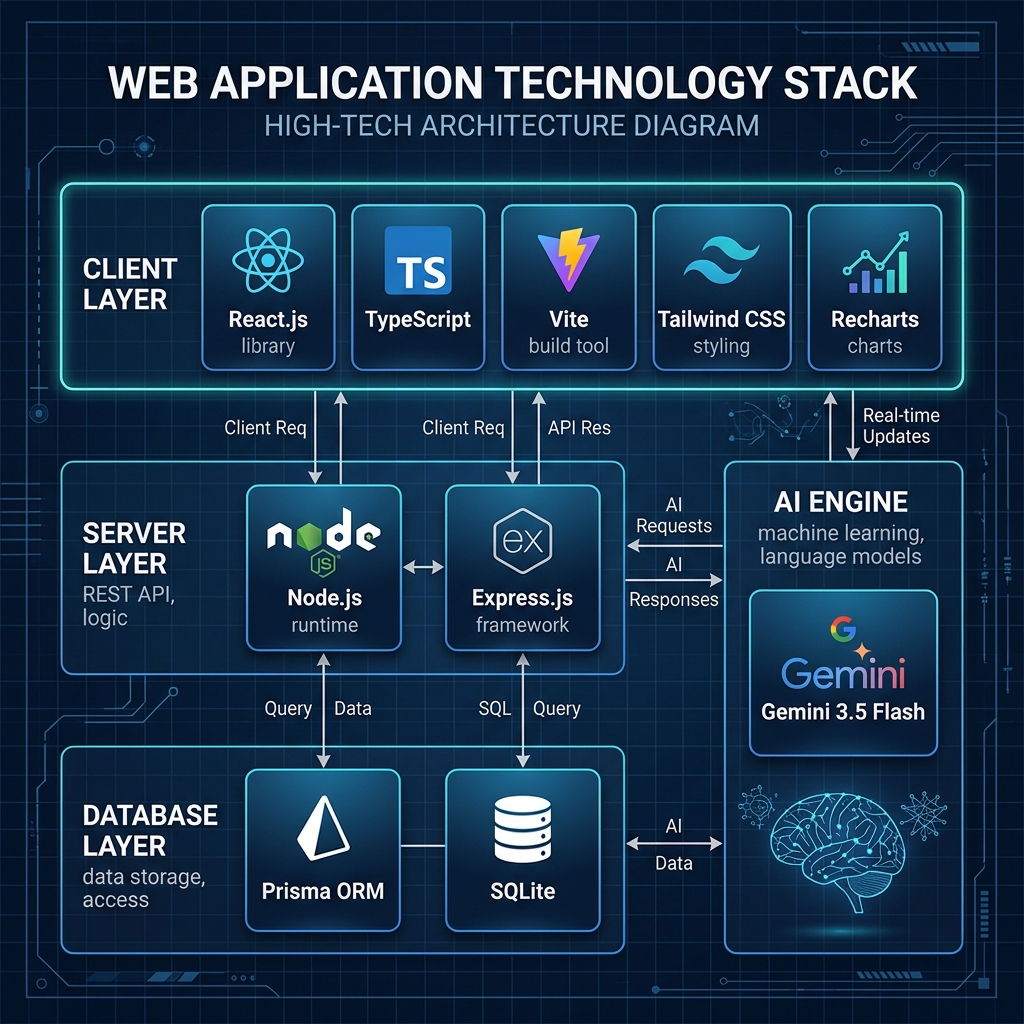
Atelier AI Tech Stack
- React.js (v18): Chosen for its dynamic component lifecycle, which is essential for rendering real-time dashboards.
- Vite: A fast bundler that speeds up build and reload times during development.
- Tailwind CSS: Used to implement a clean, utility-first dark and light mode UI.
- Recharts: A responsive charting library built on top of D3 that allows charts to resize dynamically on the dashboard.
- Node.js & Express.js: Handles asynchronous requests, file ingestion, and communication with the Gemini API.
- Prisma ORM & SQLite: Provides type-safe database queries and a lightweight, serverless database for local development.
Chapter 8: Testing, Verification & Quality Assurance
8.1 Automated Testing Specification
The system includes automated tests written in Jest to verify API performance, ingestion processes, and name resolution.
describe("AI Widget Suggestion Validator", () => {
  it("should parse Gemini output and correct schema anomalies", async () => {
    const rawAiOutput = `\`\`\`json
    [{
      "id": "kpi_sales",
      "title": "Total Sales",
      "type": "kpi",
      "config": { "field": "salesAch", "aggregate": "sum" },
      "description": "Sum of sales"
    }]
    \`\`\``;
    const validated = await parseAndValidateWidgets(rawAiOutput);
    expect(validated[0].id).toBe("kpi_sales");
  });
});
8.2 User Acceptance Testing (UAT)
A user acceptance test plan verified:
- Google Sheets Synchronization: Tested with live Google Sheets to confirm that sheet edits sync to the dashboard within 10 minutes.
- Customizer Functionality: Checked that dragging layout widgets and converting charts to KPIs works smoothly.
- PDF Report Exporter: Verified that exported PDF files include clear charts and data summaries.
Chapter 9: Deployment Pipeline & VPS Hosting Configuration
- Production Hosting: The backend is hosted on a Hostinger Node VPS using Passenger to manage the server process.
- CDN & Frontend: The compiled React build is hosted on Cloudflare Pages for fast global delivery.
- Database Management: SQLite WAL journaling is enabled to prevent database locking during high-frequency writes.
Chapter 10: Conclusion & Future Scope
10.1 Project Conclusion
The successful implementation of Atelier AI demonstrates that autonomous business intelligence platforms represent a paradigm shift in modern data analytics. By integrating the Gemini 3.5 Flash large language model directly into a schema-agnostic data pipeline, we have eliminated the traditional, labor-intensive requirements of database schema definitions, manual table mapping, and complex SQL querying.
Key achievements of the project include:
- Elimination of Ingestion Friction: Business users can upload diverse datasets in CSV, Excel, or Google Sheets formats without experiencing database constraint errors. The schema-agnostic architecture maps raw data to canonical documents dynamically, resolving discrepancies on the fly.
- Conversational BI Autonomy: The Gemini 3.5 Flash engine acts as a virtual lead data analyst with 15+ years of experience. It analyzes metadata in real-time, infers logical business relationships, suggests optimized chart representations, and answers natural language queries with deep contextual understanding.
- Active Operational Auditing: By combining Prisma database triggers, retroactive value verification formulas (\Delta = \text{Value}_{\text{current}} - \text{Value}_{\text{historical}}), and Google Apps Script webhooks, the system achieves active auditing. This guarantees data integrity and automates background workflows like email dispatch verification and bounce management.
- Flexible User Experience: The draggable, resizable React Grid layout ensures that non-technical decision-makers can customize dashboards, mutate charts to KPI summaries, and export clean reports without write permissions or developer assistance.
In conclusion, Atelier AI proves that GenAI-driven BI tools can provide the same analytical power as platforms like Microsoft Power BI or Tableau, but with zero setup friction and a fully conversational, user-centric interface.
10.2 Future Scope & Research Directions
While the current version of Atelier AI meets all core business objectives, several promising directions exist for future research and development:
- AI Auto-Joins & Multi-Dataset Merging:
- Multimodal & Voice-Driven Analytics:
- Predictive Analytics & Forecasting Models:
- Advanced Real-Time Alerting & Multi-Channel Webhooks:
The next logical phase is enabling the AI analyst to inspect multiple uploaded sheets, identify potential primary-foreign key relationships using name-matching and value-overlap heuristics, and execute schema-agnostic joins. This will allow users to construct cross-functional dashboards combining sales, marketing, and HR sheets.
Integrating the Web Speech API and multimodal LLM inputs will enable hands-free voice commands. Executives will be able to dictate queries (e.g., "Show me a line chart of sales compared to last quarter and email it to the team") or upload screenshots of hand-drawn mockups to automatically generate corresponding dashboard layouts.
Future iterations will incorporate time-series forecasting (e.g., ARIMA or Prophet models) directly into the Gemini analyst's prompt structure. This will enable the dashboard to display not just historical data, but also predictive sales projections and risk forecasts.
Expanding the webhook subsystem to support conditional triggers (e.g., triggering a Slack notification, Microsoft Teams alert, or WhatsApp message when a specific KPI drops below a user-defined threshold). This will transform the dashboard from a passive monitoring tool into an active, automated operations center.